Intro
Santa Claus Rally is a well-known narrative in the stock market, where it is claimed that investors often see positive returns during the final week of the year, from December 25th to January 2nd. But is it a real pattern or just a market myth ?
It is also claimed that next years returns are positively correlated to the Santa rally. But is it a real pattern or just a market myth ? Let’s debunk some myths with data.
Data Analysis: 7-Day Returns (December 25th to January 2nd)
To understand whether the Santa Claus Rally holds any weight, let’s look at the data.
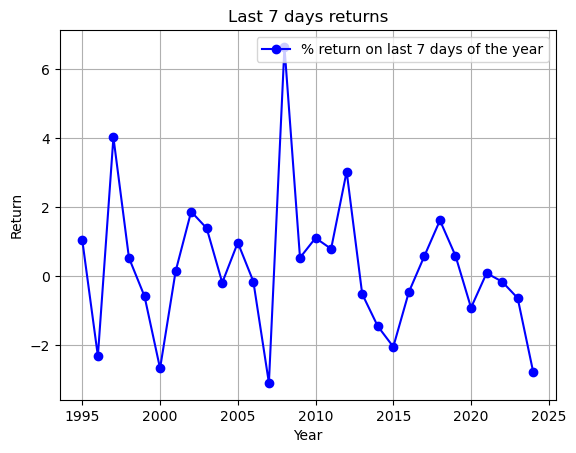
I’ve plotted a histogram showing the 7-day returns from December 25th to January 2nd since 1994.
Caveats:
- SPY data starts from 1993, but its not a full year, hence we’ve skipped it
- At times Jan 2nd is a public holiday and the market data isn’t available (example 1999-01-02). In that case, I’ve moved to the next available date to get a 7 day period (1999-01-04)

(Note that the annual returns are for the following year, hence you see the last negative annual return on 2007, instead of 2008)
From the histogram, we can see that
Myth 1 - ❌ Busted
1. Positive years: 16
2. Negative years: 14
3. Total years: 30
4. Percentage of times the last 7-day **return is positive: 53.33%**
5. Percentage of times the last 7-day **return is negative: 46.67%**
Why the myth ?
I have no idea where the folklore comes from, but the last 7 days aren’t always positive! Its almost a coin-flip with 53% probability.
One reason could be that the last few years post covid have had more negative Santa rallies, bringing the frequency and average returns down.
At the end of the day, we have very limited samples for annual returns - and this is probably what causes a sampling bias when reported in media.
Normalised returns - considering duration
Now, 7 days and 365 days are quite different, so its not an apples to apples comparison.
Let’s normalise the returns - i.e, divide the returns by the duration 7, or 365 to make it an apples to apples comparison
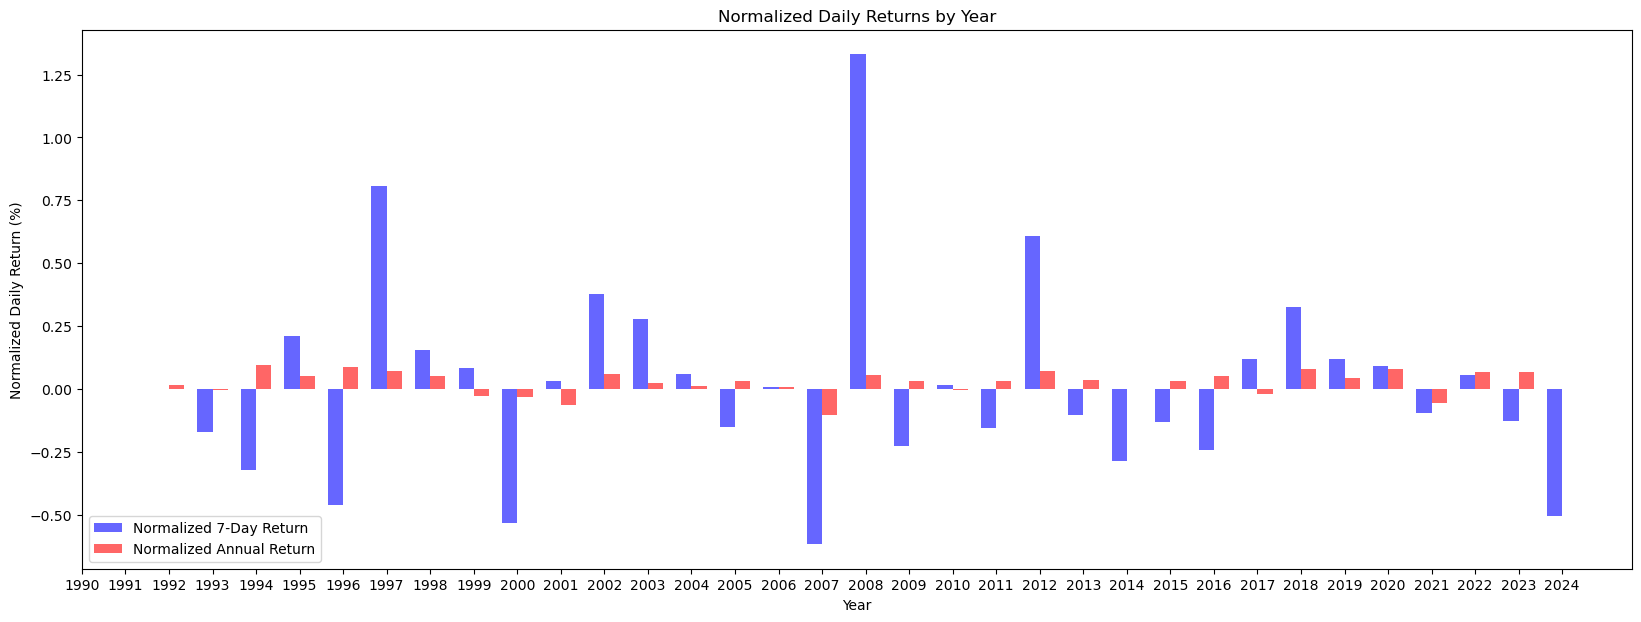
Insight: So it’s clear that the last 7 days have a huge positive/negative impact return and the market is more volatile.
But its probably unfair to say that its mostly always “Positive” as the conventional wisdom says - In fact, its equal times negative, as it is positive - with a large amplitude of returns.
If you only consider the last 10 years, its a 53% probability of positive vs negative last 7 day returns.
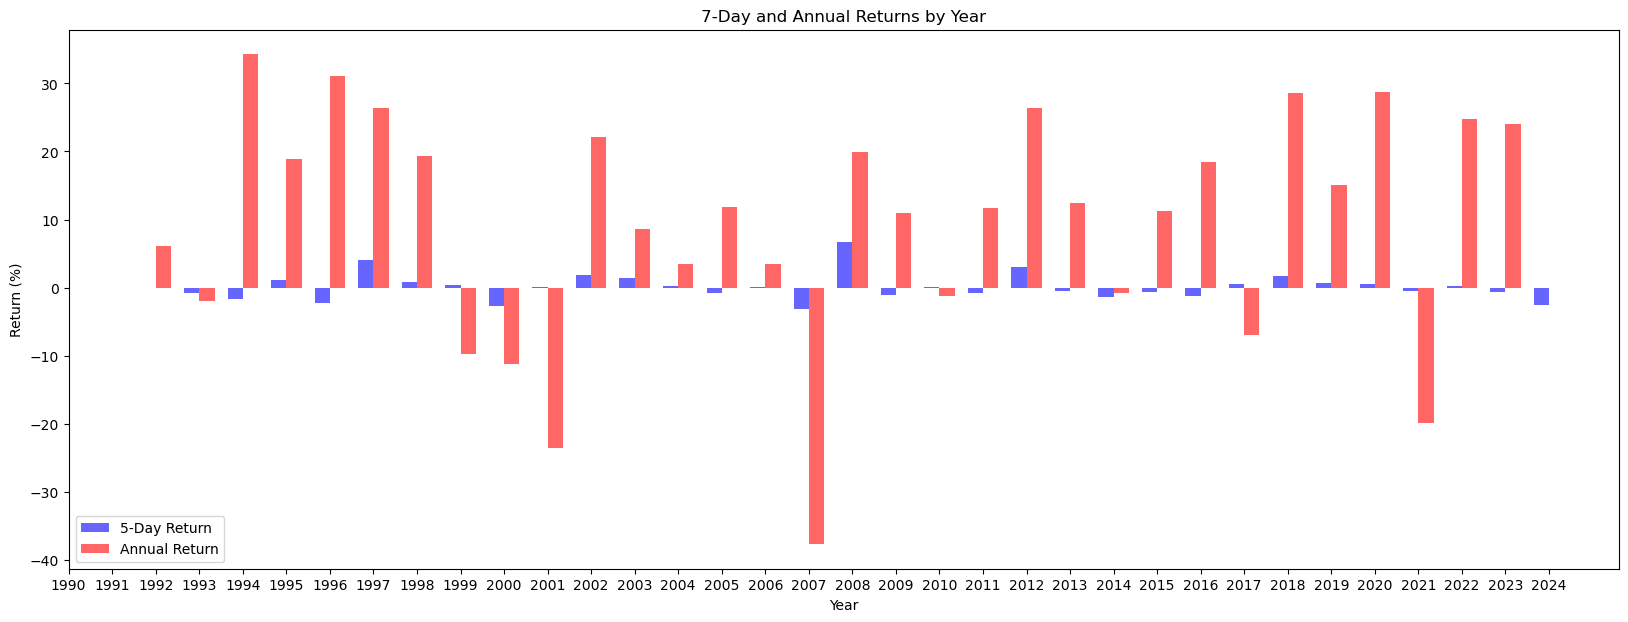
How about the annual return ?
Thats more interesting - its a split of 70% positive, and 30% negative - which is fair and well established fact. Market goes up more than it goes down.
Correlation with Next Year’s Annual Returns
Next, let’s look at the annual returns of the following year again and examine if there’s any relationship between the 7-day returns at the end of the year and the performance for the next year.
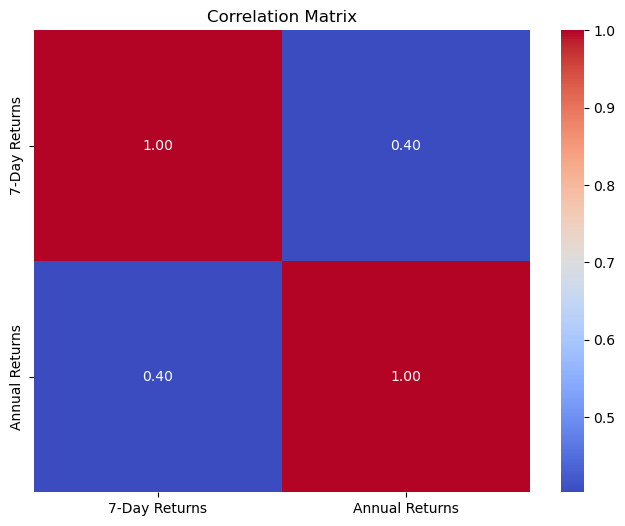
 The correlation coefficient between the 7-day returns and the next year’s annual returns is 0.4.
Myth 2 - ❌ Busted: While there is a moderate positive relationship, it is NOT a strong correlation that the last 7 days’ performance will predict next year’s overall performance.
2024 Santa Rally was Negative - What can we learn?
Let’s filter only the negative years and see if there is some pattern
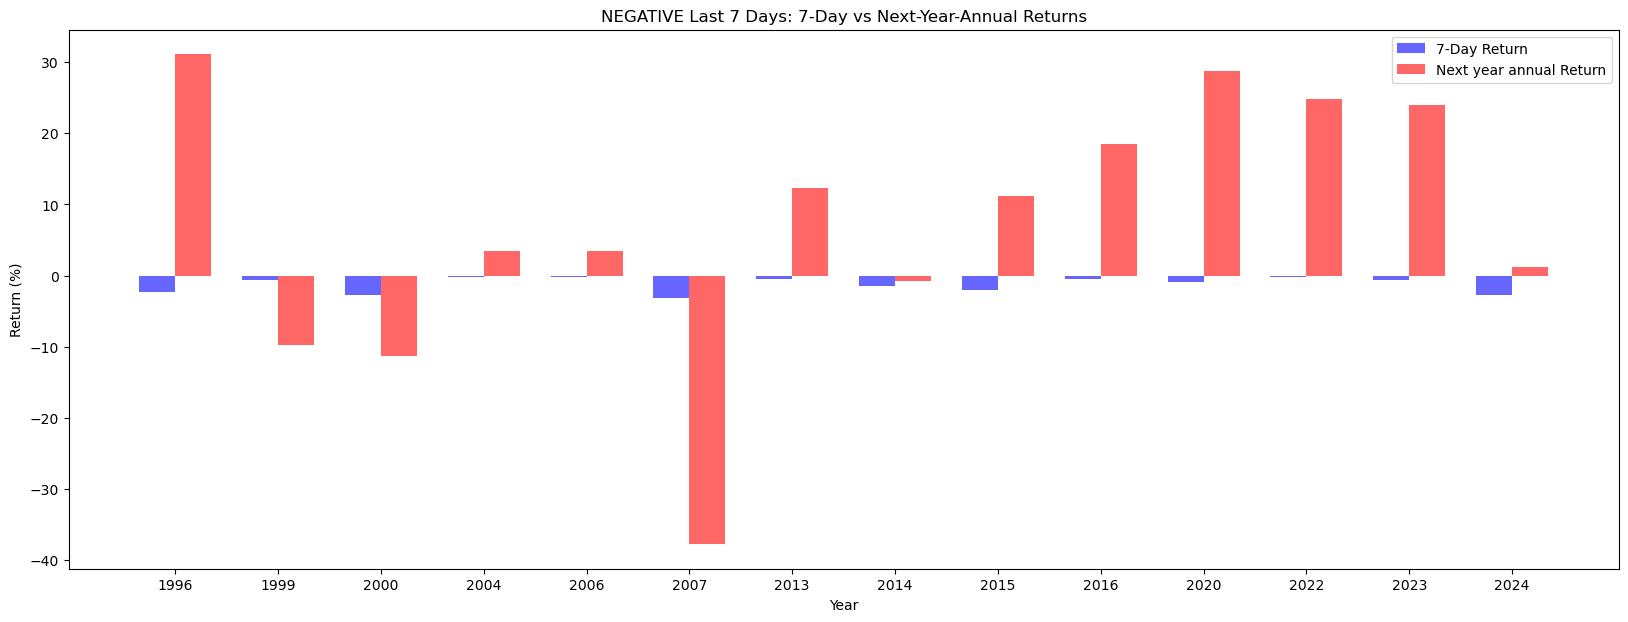
Myth 3 - ❌ Busted: 10 out of 14 times the last 7 days were negative - the annual return was positive!
Conclusion: Myth or Fact?
While the Santa Claus Rally has become part of market lore, the data reveals that it’s mostly NOT true.
In fact, the 7-day return from December 25th to January 2nd is positive less than half the time.
Moreover, the correlation with the following year’s annual returns is moderate (0.4), indicating that while there may be some relationship, it’s not a strong or consistent predictor.
So, while the Santa Claus Rally is an intriguing concept, it’s important to remember that market performance can be unpredictable - and past patterns don’t always guarantee future results.
Infact, the data suggests there is a 71% (10/14) probability 2025 returns will be positive! - STAY INVESTED